Variables app for iPhone and iPad
Developer: Sergiy Protsiv
First release : 12 Oct 2011
App size: 7.09 Mb
Variables is a highly intuitive app for data analysis. Explore your data, create robust models and prepare stunning visualizations. All with your fingertips.
Variables can perform:
- descriptive analysis of both numerical and categorical variables
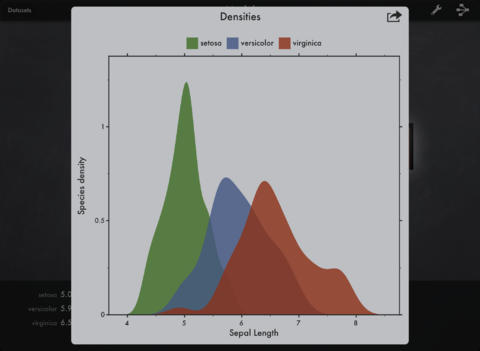
- visualizations of the distribution of a single variable, like histogram and kernel density estimates (note that it is not currently possible to customize the plots)
- measuring association between variables (for example, correlation and covariance)
- plotting two variables versus each other to create a scatterplot
- all of the above, but classified by categories taken from another variable
- model building that currently includes Linear, Logistic and Poisson regressions
And in addition Variables determines the most appropriate type of analysis based on the kind of your data and the model structure you suggest!
Currently Variables can import data from CSV (comma-separated values, but in truth semicolon- or tab-separated values are fine too) and can export tables as RTF or plain text and graphs as PDF or PNG.
"If the statistics are boring, then youve got the wrong numbers". -- Edward R. Tufte


